Table of Contents
Fun With Convolution, Linear Time-Invariant Systems, and the Allen Fieldhouse
[The text of this paper was originally published in the Proceedings of the ASEE Midwest Section Conference, Lawrence, Kansas, September 2010. Some examples and photos have been updated since then. This page has been visited 40708 times.]
Abstract
This paper describes an out-of-class experiment and a subsequent lab exercise for the junior-level Electrical Engineering course commonly titled as “Signals and Systems.” The main objective of these activities is to capture the imagination of the students and let them have fun with the sometimes-tedious concepts of convolution and linear time-invariant systems. The basic concept is for the students first to record the acoustic “impulse response” of a building on campus. Next, they return to the lab and play their own voices through the mathematical model of the building (i.e., the “impulse response”) in order to mimic the effect of speaking inside the building. To enhance the experience, the building is chosen to be the Allen Fieldhouse at the University of Kansas, which is the tradition-filled building on campus where basketball games are played. Because the signals and systems are chosen from their everyday experience, and because of the simple effectiveness of the experiment, the students are able to appreciate the challenging concepts of the course in a novel and meaningful way.
Introduction and Background Discussion
Early in life, I had a memorable experience while riding in the back seat of a car. The car belonged to Stuart, the best friend of my older brother. Stuart—it seemed—was the kid who had everything. On this occasion, Stuart was showing off his new car stereo and its impressive set of features. One button on the stereo's front panel was labeled “stadium mode.” When this button was pressed, the music coming out of the stereo sounded as if it was being played at a large football stadium, as depicted in Figure 1. In other words, it sounded as if the music was being played at a rock concert. How was this accomplished? What did the stereo's engineers put inside in order to make this happen? There are many approaches one could take to answer these questions and design this feature. As a frequent instructor for the junior-level Electrical Engineering course commonly titled as “Signals and Systems,” there is one approach that, to me, seemed especially obvious and fun.
Figure 1. An abstract depiction of a stereo in “stadium mode.”
The remainder of this paper is organized as follows. In the next section, a hypothetical signals-and-systems-based approach to the “stadium mode” design problem is outlined. Following that, a real-world application of this hypothetical approach is described. The “stadium” in this real-world application is the Allen Fieldhouse at the University of Kansas (KU), which is the tradition-filled building on campus where basketball games are played. The “stereo engineers” in this real-world application are the students in the “Signals and Systems” course at KU. The end result is a lot of fun for the students and an increased appreciation for the principles developed within the course.
A Signals-and-Systems-Based Approach to the "Stadium Mode" Design Problem
A straightforward application of “Signals and Systems” principles to the “stadium mode” design problem involves the following key ideas:
- We can model the stadium as a linear time-invariant (LTI) system. (We could have a long debate about the accuracy/inaccuracy of this model. However, we will reserve judgement for now and simply wait to see how things turn out.)
- We then recognize that an LTI system is completely described by its impulse response h(t). Given its impulse response, the input-output relationship of an LTI system is given by
 which is the well-known convolution integral [1] and is depicted in Figure 2 (a). Linear constant-coefficient differential equations, for example, are LTI systems. The great utility of Equation (1) is that we don't have to bother with “particular solutions” and “homogeneous solutions” and the educated guessing“ they require. Equation (1) gives an explicit relationship between an arbitrary input signal x(t) and its corresponding output signal y(t). Thus, when presented with an input signal x(t), we don't have to “guess” the form of the particular solution, we instead have the “simple” task of computing the integral in Equation (1). I wrap the word simple in scare quotes because students certainly do not find it to be simple at first! Ultimately, convolution has enormous practical value because most real-world input signals (such as the human voice, or music) do not have simple mathematical formulas [such as cos(wt)]. Therefore, arbitrary input signals (such as the human voice) frustrate any attempts to guess the closed form of the output signal. Equation (1), on the other hand, can be programmed into a computer, and the computer finds the computation of Equation (1) to be quite simple. Therefore, we can compute y(t) given an arbitrary x(t) without the need for guesswork.
- We also recall that—as its very name suggests—the impulse response h(t) is simply the output of the system given a very special input: the impulse function, or δ(t). This special experiment involving δ(t) and x(t) is depicted in Figure 2 (b).
Figure 2. (a) Relationship between the input signal, x(t), the output signal, y(t), and the LTI system with impulse response h(t). (b) Special experiment with input signal x(t) = δ(t), which produces the output signal y(t) = h(t).
Based on the above points, the stereo's engineers—hypothetically speaking of course—could have followed a few simple steps to implement their “stadium mode”:
- Go to the nearest stadium.
- Excite the stadium with an impulse function.
- Record the resulting impulse response.
- Program the impulse response and the convolution integral into the stereo.
- Listen to the result and smile.
One minor remark is in order. In a computer-based implementation, the discrete-time counterpart to Equation (1) must be used, which is the convolution sum and is given by  where y[n], x[n], and h[n] are discrete-time counterparts to the continuous-time quantities in Equation (1).
Real-World Application of the Signals-and-Systems-Based Approach
On multiple occasions, the “Signals and Systems” students at KU have carried out the above-outlined approach as part of a lab exercise in the course. The exercise has been an unqualified success.
Given the lofty status of basketball at KU, and the close proximity of the main basketball facility to the engineering buildings, the Allen Fieldhouse was selected as the “stadium.” The use of the Allen Fieldhouse played a big part in capturing the imagination and enthusiasm of the students.
The primary challenge faced by the students was what to use as an impulse function. Without going into an unnecessary amount of detail, δ(t) is used to denote a pulse with unit area whose duration is so short that making it any shorter would have no noticeable effect on the system to which it is applied [1]. With this understanding, the students agreed that they must produce sounds that were both loud and brief, in order to approximate an impulse as best they could.
In Spring 2012, the ideas they came up with were:
- A whistle [Audio Clip] [Video Clip];
- Popping a ziploc bag [Audio Clip] [Video Clip];
- Popping the lid off a small tube [Audio Clip] [Video Clip];
- Striking a wine glass [Audio Clip] [Video Clip];
- A “popping” toy [Audio Clip] [Video Clip];
- Popping a grocery sack [Audio Clip] [Video Clip].
In Fall 2010, the ideas they came up with were:
- Shooting an “air cannon” [Audio Clip] [Video Clip];
- Closing a book [Audio Clip] [Video Clip];
- Slamming two books together [Audio Clip] [Video Clip];
- Slamming two plastic clipboards together [Audio Clip] [Video Clip].
In Spring 2010, the ideas they came up with were:
- Popping a balloon [Audio Clip] [Video Clip];
- Bouncing a basketball [Audio Clip] [Video Clip];
- A clap [Audio Clip] [Video Clip].
In Spring 2009, the ideas they came up with were:
- Banging two blocks of wood together [Audio Clip] [Video Clip];
- Banging a block of wood on a large plastic garbage can [Audio Clip] [Video Clip];
- A scream [Audio Clip] [Video Clip].
Acoustic recordings of the impulse responses were captured at the Allen Fieldhouse with a laptop computer with a microphone attached. The resulting audio files (along with video clips of all the action!) were posted on the class web page for use in the lab exercise. (As you can see, links to these recordings and video clips are given above for your convenience.)
In the computer-based lab exercise, the students followed the simple step-by-step procedure below:
- Record a sample of your own voice and save it as an audio file.
- Download the recordings of the acoustic impulse responses from the class webpage.
- Convolve the impulse response with the recorded sample of your voice.
- Listen to the result and smile.
We used the widely-known Waveform Audio File (WAVE) format and the computer package MATLAB™ [2] We used the following built-in MATLAB™ commands: waveread, conv, and (optionally) wavewrite.
Here is an example of the lab experiment. For the “input signal,” we use a recording of someone speaking as if they are the announcer at a basketball game [Audio Clip]. It is important to note that this recording was not made at the Allen Fieldhouse. The next step is to convolve this input signal with each of the impulse responses posted above. The resulting files are given below:
- Announcer after applying the “whistle” impulse response [Audio Clip];
- Announcer after applying the “ziploc” impulse response [Audio Clip];
- Announcer after applying the “tube” impulse response [Audio Clip];
- Announcer after applying the “glass” impulse response [Audio Clip];
- Announcer after applying the “toy” impulse response [Audio Clip];
- Announcer after applying the “grocery sack” impulse response [Audio Clip];
- Announcer after applying the “air cannon” impulse response [Audio Clip];
- Announcer after applying the “book close” impulse response [Audio Clip];
- Announcer after applying the “two books” impulse response [Audio Clip];
- Announcer after applying the “two clipboards” impulse response [Audio Clip];
- Announcer after applying the “balloon” impulse response [Audio Clip];
- Announcer after applying the “basketball bounce” impulse response [Audio Clip];
- Announcer after applying the “clap” impulse response [Audio Clip];
- Announcer after applying the “wood blocks” impulse response [Audio Clip];
- Announcer after applying the “trash can” impulse response [Audio Clip];
- Announcer after applying the “scream” impulse response [Audio Clip].
Discussion and Conclusion
In the end, the experiment and the lab exercise were a great success. First of all, it presented a number of learning opportunities. For example, in Spring 2009, the students loved the fact that both uses of the wood blocks as impulses produced very realistic Allen-Fieldhouse-like recordings back in the lab. However, the use of a scream as an impulse produced terrible results. Because of the first two successes, the students were able to conclude that—for our purposes—it was reasonable to model the Allen Fieldhouse as an LTI system. Given this fact, it was easy for them to explain the failure of the scream impulse: simply put, a scream is not a good example of an impulse when capturing the acoustic impulse response of a building. Then, in the case of the block-of-wood-on-garbage-can impulse—quite remarkably—the output signal sounds as one imagines it would if it were uttered from the bottom of a garbage can at the Allen Fieldhouse, even though it was originally spoken and recorded in an ordinary office.
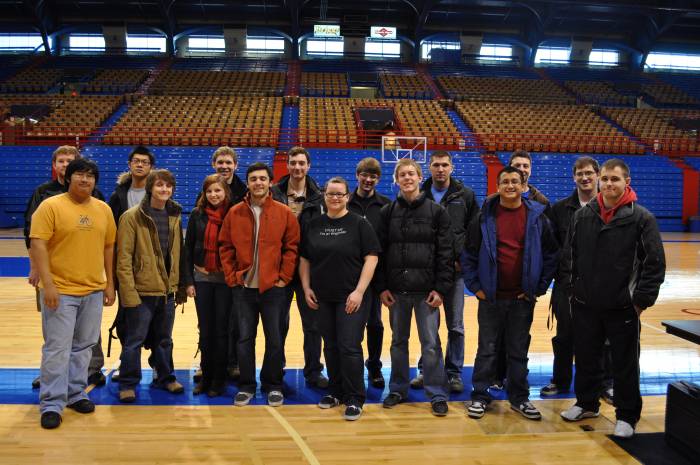
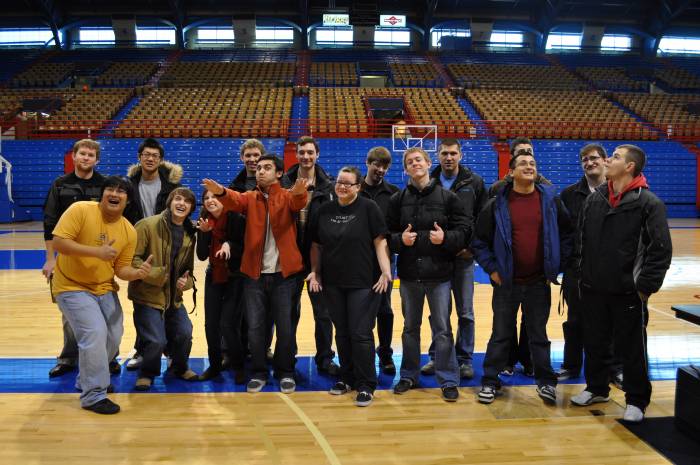
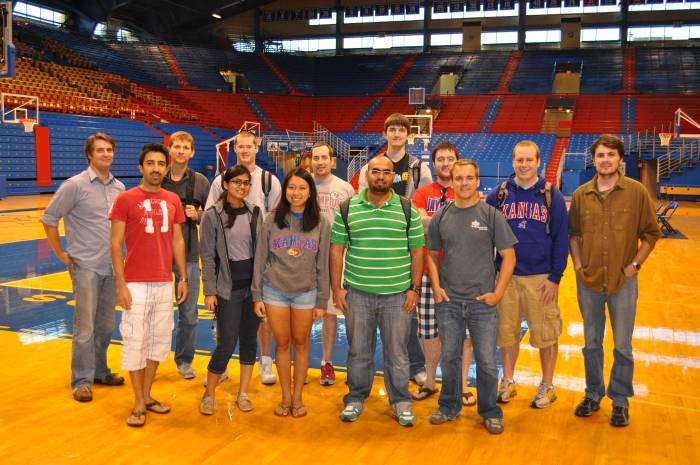
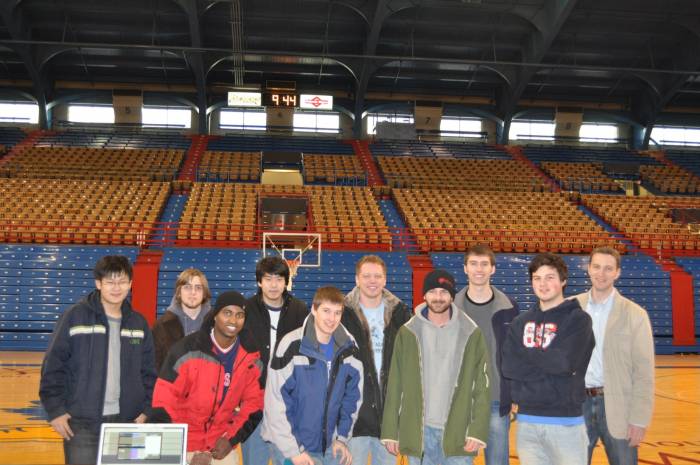
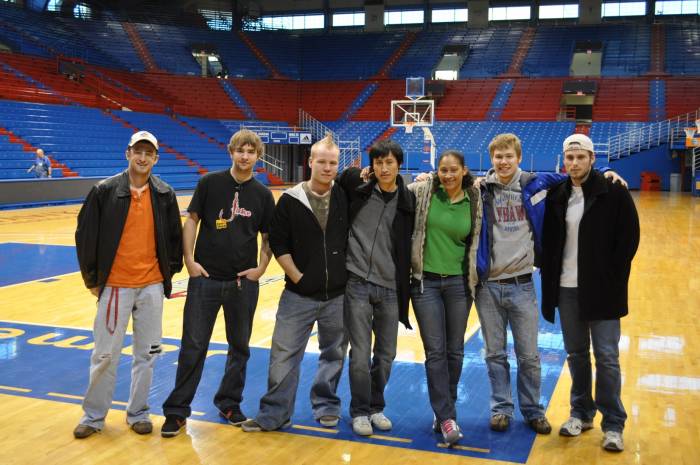
Second—and perhaps most important of all—the entire event was a great success because it captured the imagination and enthusiasm of the students, as shown in the photos below. We look forward to repeating this exercise in years to come!
(Serious) group photo of the “Signals and Systems” students at the Allen Fieldhouse at KU in Spring 2012.
(Goofy) group photo of the “Signals and Systems” students at the Allen Fieldhouse at KU in Spring 2012.
Group photo of the “Signals and Systems” students at the Allen Fieldhouse at KU in Fall 2010.
Group photo of the “Signals and Systems” students at the Allen Fieldhouse at KU in Spring 2010.
Group photo of the “Signals and Systems” students at the Allen Fieldhouse at KU in Spring 2009.
[1] A. V. Oppenheim and A. S. Willsky, Signals and Systems. New York: Prentice Hall, 1997.


